
ENhanced Geothermal
Innovative Network
for Europe
Innovative Network
for Europe
LITHUANIA

Geothermal Measurements in Wells
Copyright Any? 2007 by Saulius Sliaupa sliaupa@geo.lt
Institute of Geology & Geography
 |
Geothermal Field of The Baltic Region |
 |
Geothermal Data |
|
Enhanced Geothermal Systems |
|
Klaipėda Geothermal District Heating Station |
|
Ongoing Research |
|
Publications |
|
Publications (Lithuania) |
More than 500 deep wells were drilled in Lithuania for oil exploration, geological mapping and gas storage research. Temperatures were measured (after reaching thermal equilibrium) in about 150 wells that provide basic information on underground temperature distribution in the uppermost 0.5-2.5 km zone of the earthxs crust. Different methods were used (a) thermal logging; (b) mercury xabsolutex thermometer during the drill stem test; (c) single measurement of water during testing of aquifer; (d) measurement of water temperature pumped up from deep aquifer to surface.
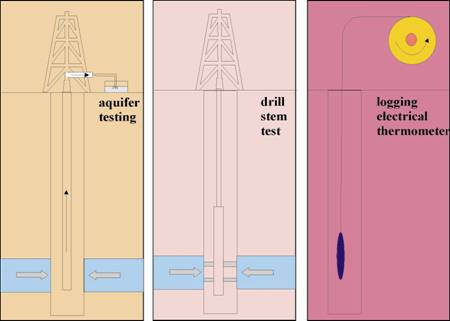
Geothermal measurements of deep wells used in Lithuania
Thermal logging was performed under two different conditions: (i) well in equilibrium state; (ii) well in non-equilibrium state. The latter was used to map the quality of the casing of the well. The equilibrium state was reached by keeping the well in undisturbed state for 10-12 days, though sometimes this stillness period was cut for several days, on the other hand, quite often the wells were left undisturbed for several months. For example, the repeated thermal logging was performed 3 years after drilling activities were stop (1993 and 1996). It is interesting to note that at depths shallower than 1300 m the temperature measured in 1993 (well has been kept for 18 days in quiescence before logging) is for 5-1oC higher than that measured in 1996. The values are the same at the depth of 1300-1600 m. Bellow 1600 m the curve of repeated logging outpaces the old one and at the depth of 1975 m shows temperature higher for 2oC than the value obtained in 1993.
It is crucial that temperatures were measured when descending the electric thermometer down the well, thus the tool does not disturb the drilling mud (or water) during the logging, consequently registering its natural temperature distribution in a well. The electric thermometer provides continuous thermogram.
The thermal logging was commonly performed in oil exploration wells immediately after the well casing for inspection of quality of the casing pipes cementation, and it provides data on non-equilibrium temperature distribution. As a rule, these data show increased temperatures in the upper half of the well and decreased values in the lower half, and do not reflect the natural temperature distribution. Still, the certain corrections can be introduced, which may be of help when studying underground temperatures.
As the second method, the mercury xmaximumx thermometer was used quite often to measure temperatures at fixed intervals every 100, 200 or 500 m. The third method characterise the single measurements of the water during aquifer testing by using xmaximumx thermometer. For this, the thermometer combined to manometer are inserted into the testing tool.
Each of the afore-described methods bears some shortcomings and advantages. The comparison of the measurement data shows that values obtained by electric thermometer in some cases are significantly lower than temperatures registered by mercury thermometer. The highest temperature was measured in the well Vabalai-1. The test took place after 12 days of quiescence. The lowest temperature is 8.6oC. The highest measured temperature reaches 104oC at the depth of 2301 m (Early Precambrian crystalline basement). The measurement was performed by using electric thermometer TC-2Y Nr.16 in 05/11/1986.

Comparison of thermal logs with drill stem and point thermometer measurements in west Lithuania. (A) - good fit; (B) - thermal log data have systematic error showing lower values; (C) - thermal log data have systematic error showing higher values.
The fourth method of temperature measurement of the water pumped up from the well to surface was used in fifties-sixties. The obtained values are significantly reduced, though they also provide some geothermal information (the lower limit).
Majority of thermal log activities took place in western part of Lithuania. Some well clusters were studied in southern Lithuania, for example, Lazdijai and Varena mapping areas, also in the East Lithuania (Druksiai mapping area). In the rest of the territory the measurements are only scarce.
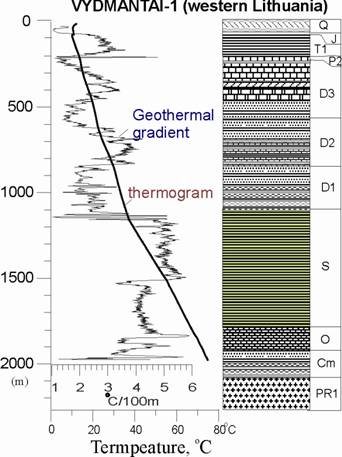
Typical thermogram of west Lithuanian well